What We Learned From Analyzing 8,446 Families in the College Recruiting Process
One of the biggest problems in the college recruiting world is that there's a lot of opinion—but not a lot of data.
Most recruiting advice comes from:
Personal experience
Anecdotes
Assumptions
Social media opinions
Isolated success stories
People often share what they believe to be true about recruiting.
But very few people are actually analyzing large amounts of recruiting data to identify patterns and trends.
That's something we want to change at D1 Scholarship.
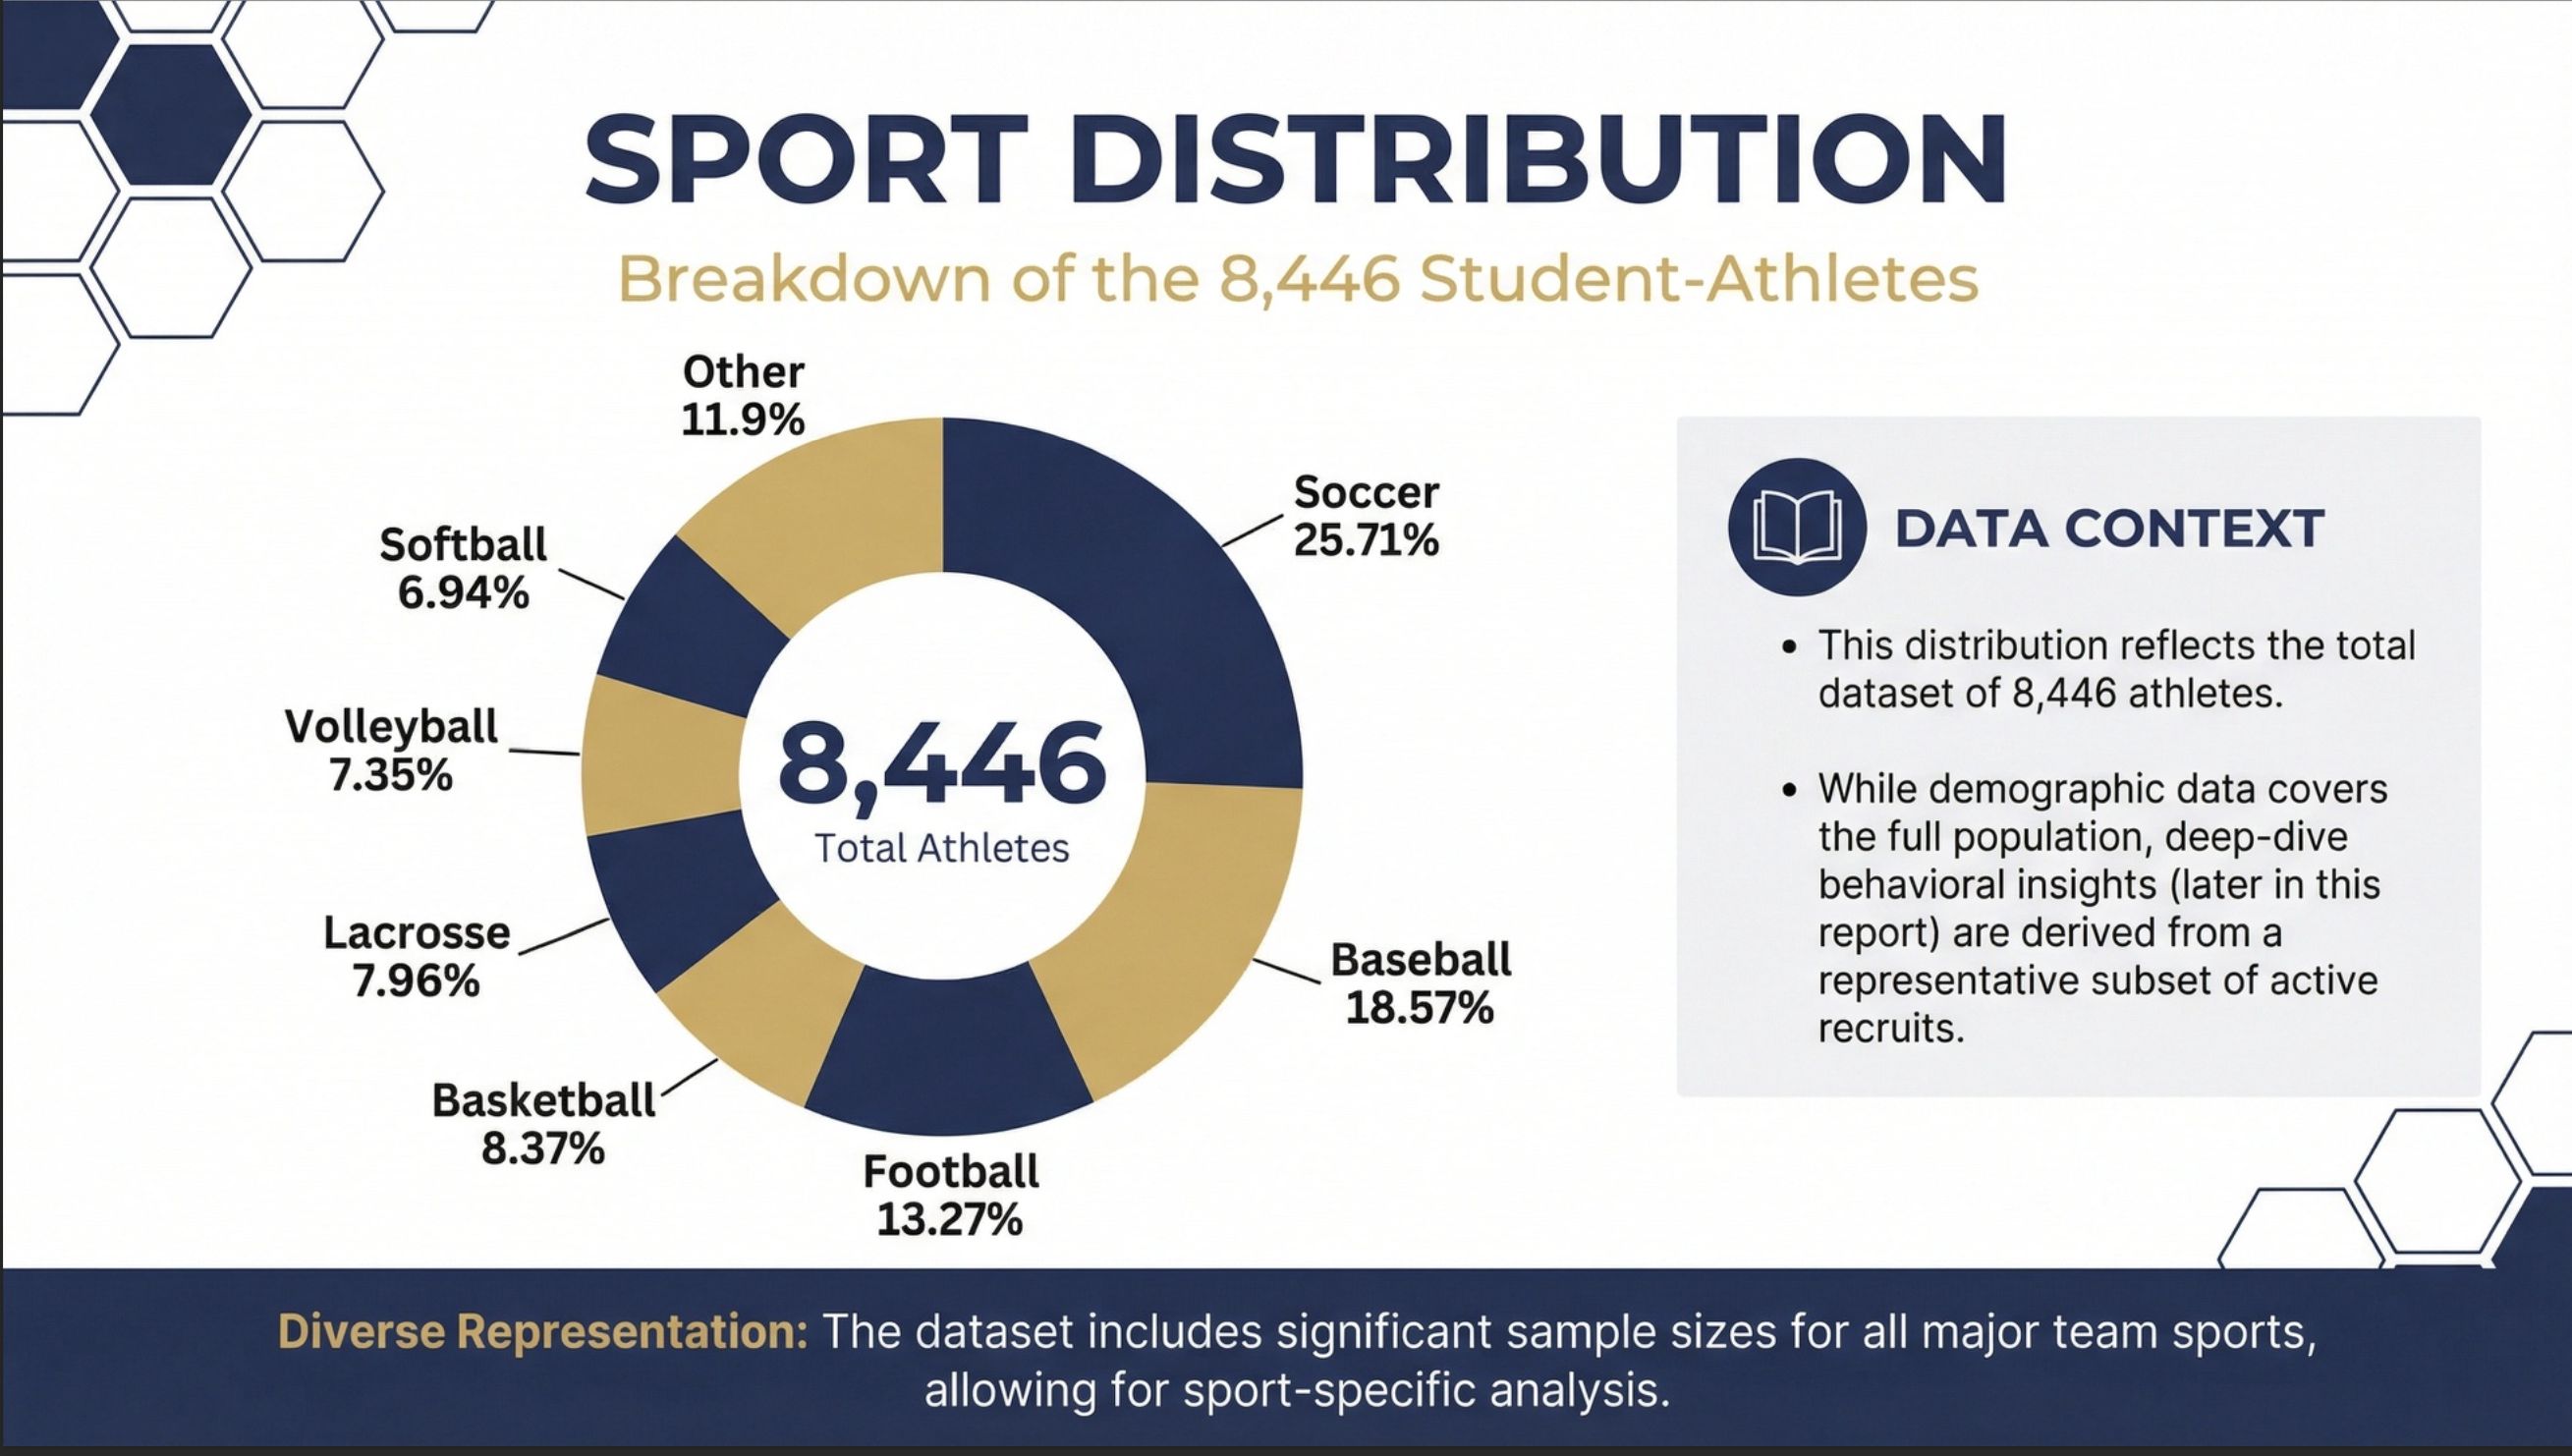
So we analyzed data from 8,446 families across multiple sports to better understand how athletes are actually getting recruited.
And some of the findings were extremely interesting.
Where This Data Came From
Before we dive into the numbers, it's important to clarify something.
This data was synthesized from multiple sources, including:
Client intake forms
Recruiting surveys
Results tracking
Internal analytics
Recruiting activity data
Different metrics have different sample sizes behind them, meaning some conclusions are based on larger data sets than others.
However, combining multiple recruiting data sources provides one of the most comprehensive views of recruiting trends currently available.
The goal here isn't to pretend recruiting is perfectly predictable.
The goal is to identify meaningful patterns that can help families make smarter decisions.
Most Athletes Are Not Contacting Enough Schools
One of the first things we looked at was:
How many schools are athletes actually contacting?
Here's what we found:
18% of families contact 0–25 schools
32% contact 26–50 schools
22% contact 51–75 schools
15% contact 76–100 schools
9% contact 101–150 schools
4% contact more than 150 schools
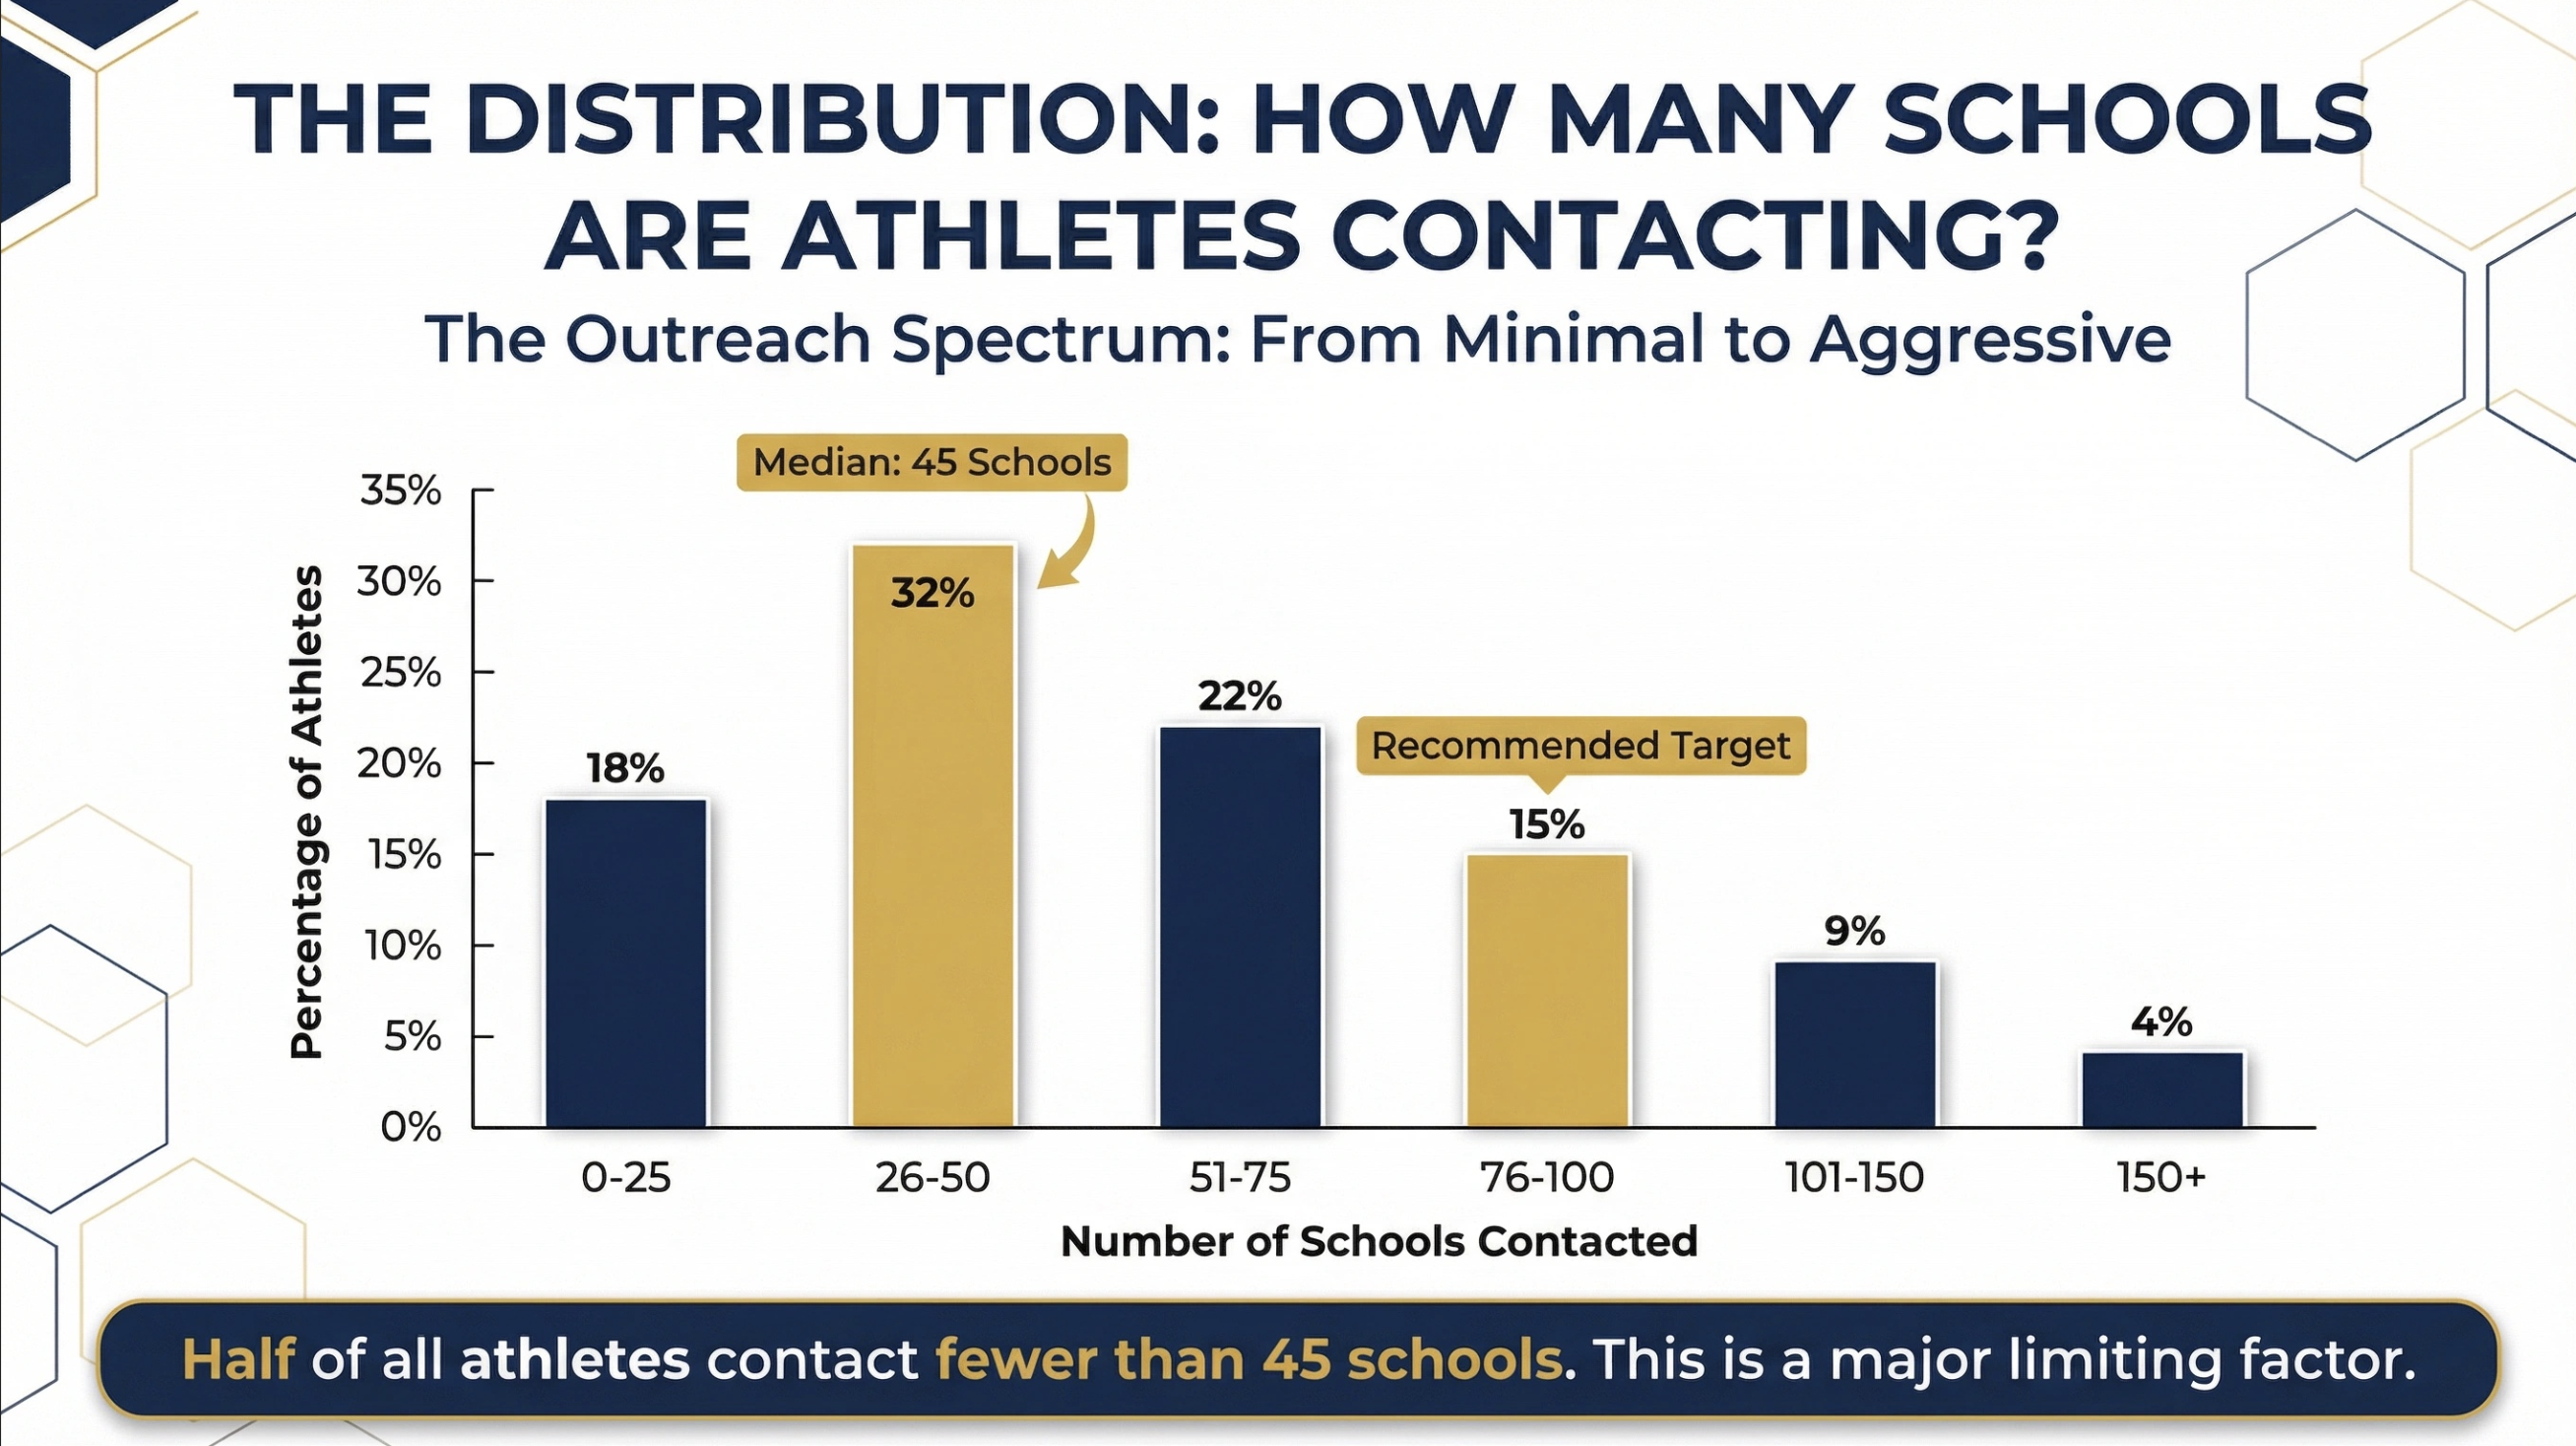
The median number of schools contacted was just 45 schools.
That means half of all athletes contact fewer than 45 schools during the recruiting process.
That's a massive problem.
Because recruiting is heavily driven by exposure.
And most athletes simply are not creating enough exposure opportunities.
What's especially interesting is that we found two major jumps in recruiting interest volume.
The First Major Jump: 50+ Schools
Families who contacted at least 50 schools saw an average 58% increase in recruiting interest.
The Biggest Jump: 76+ Schools
The largest jump happened when families contacted at least 76 schools.
Those families averaged 83% more recruiting interest.
This doesn't necessarily mean every athlete should blindly contact 200 schools.
But it does suggest that most athletes are dramatically under-exposing themselves.
Not sure where your family stands right now? Take our free 2-minute 100K Scholarship Roadmap quiz to discover which recruiting stage you're in and get a free recruiting guide customized to your situation.
Most Families Are Only Talking to a Handful of Schools
We also analyzed how many schools families were actively communicating with.
That includes:
Email conversations
DMs
Phone calls
Ongoing recruiting interest
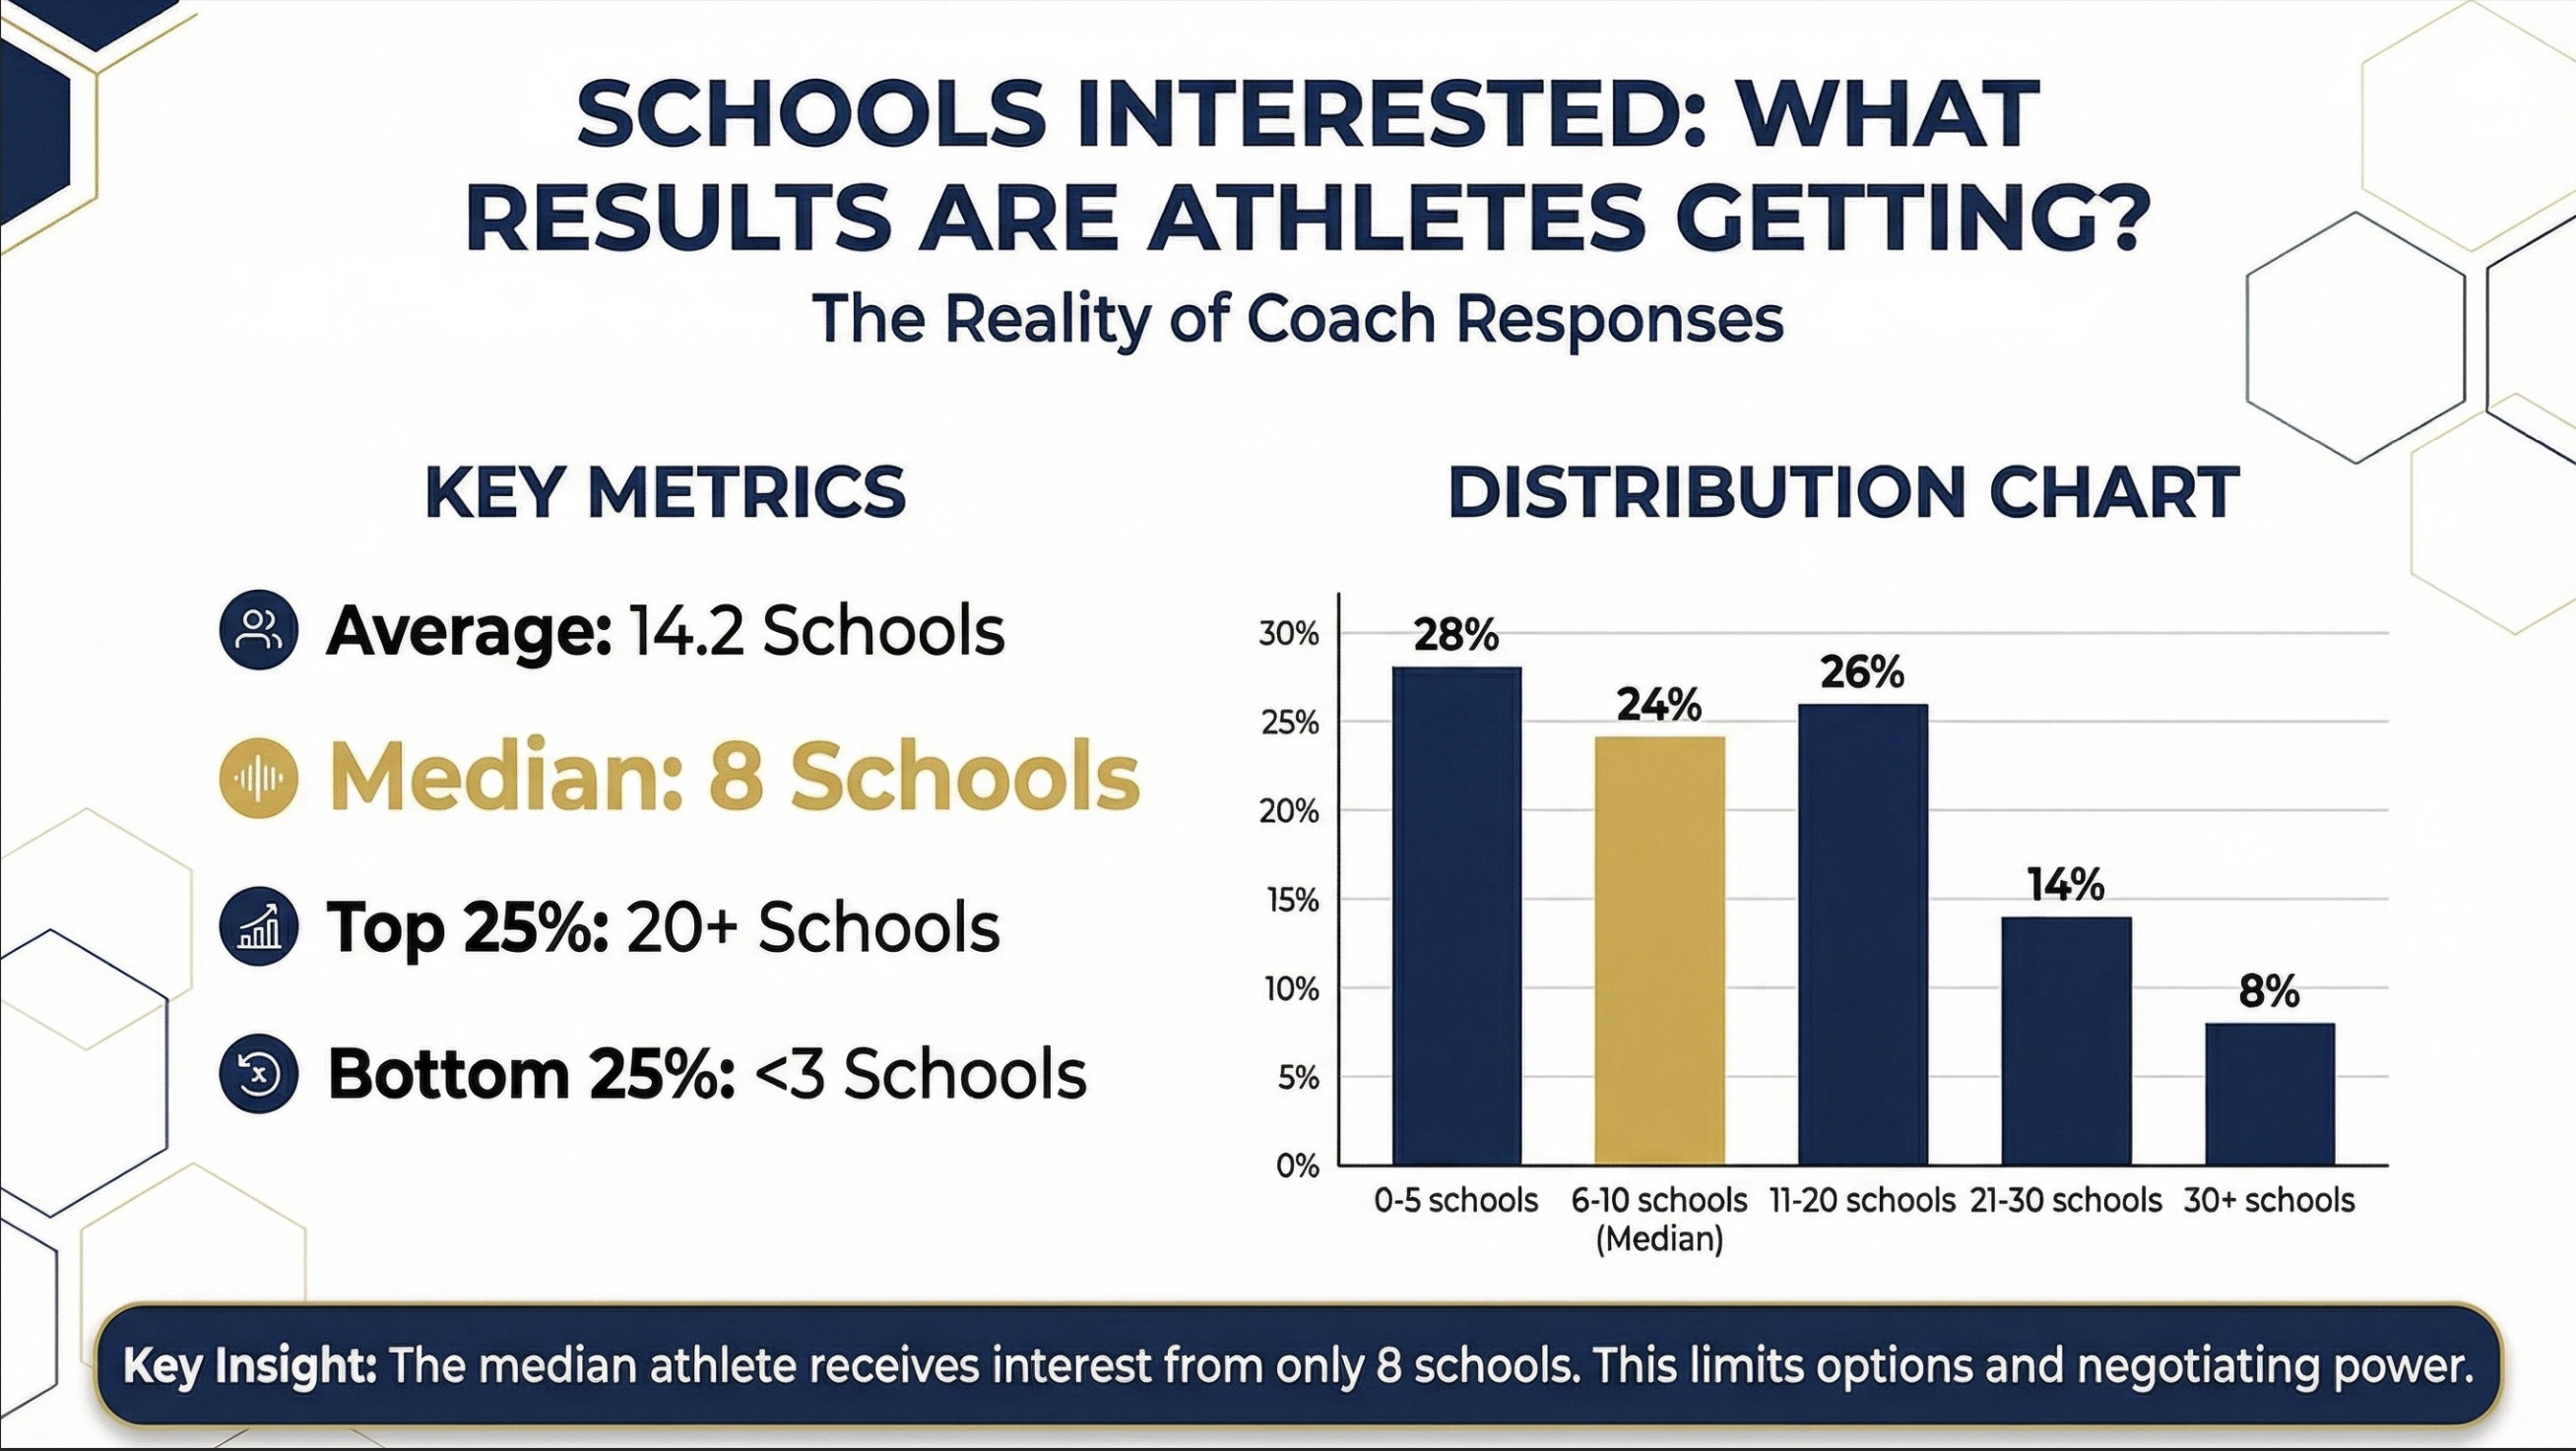
The average athlete was talking to 14.2 schools.
But the median was only 8 schools.
That tells us something important:
A relatively small group of families is pulling the average upward.
Most athletes are really communicating with around eight schools.
We also found:
The top 25% of families were talking to 20+ schools
The bottom 25% were talking to fewer than 3 schools
In other words:
Many families are operating with extremely limited recruiting opportunity volume.
Email Is Still the Most Powerful Discovery Tool
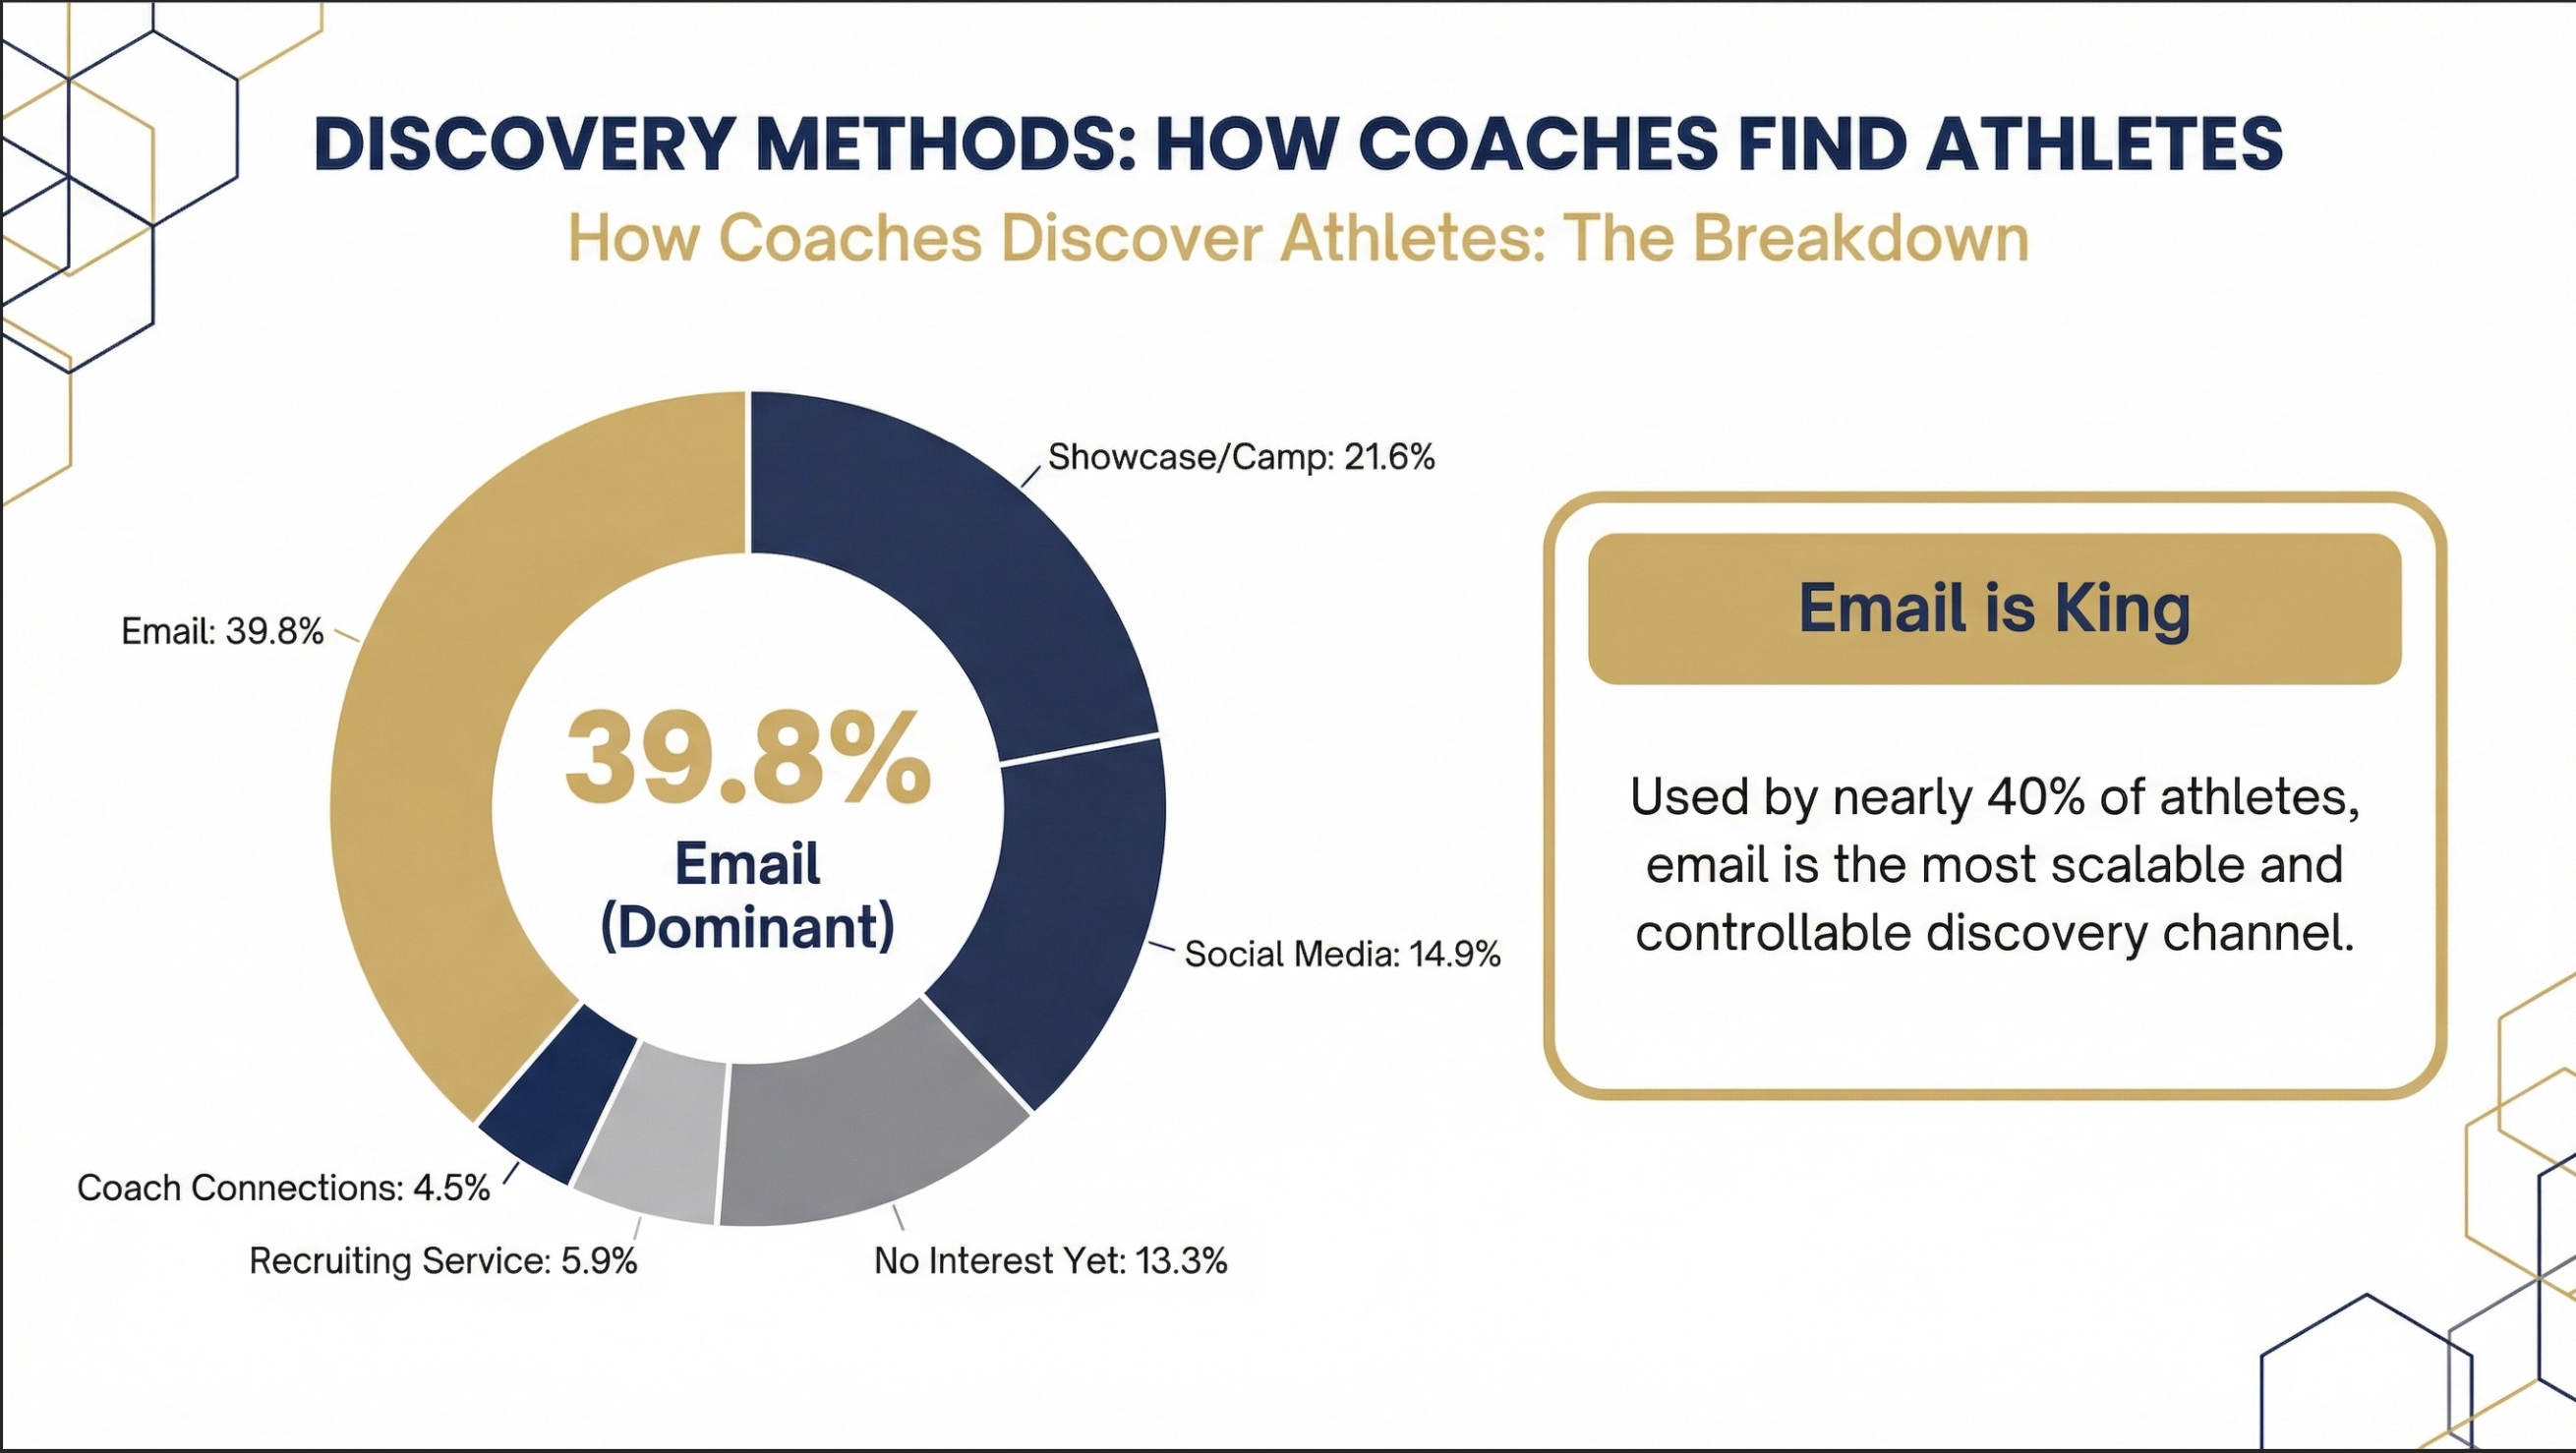
We asked families how they primarily generated recruiting interest.
Email was the dominant answer by far.
Here's the breakdown:
Email: 39.8%
Showcase/Camp: 21.6%
Social Media: 14.9%
No Interest Yet: 13.3%
Recruiting Service: 5.9%
Coach Connections: 4.5%
This is important because many families assume:
Camps are the primary way athletes get recruited
Connections are everything
Coaches don't read emails
The data suggests otherwise.
Email remains one of the most powerful recruiting tools available.
That said, recruiting methods vary heavily by sport.
For example:
Volleyball families reported email as the primary discovery method 67% of the time
Track families also reported 67%
Soccer was high at 55%
Football, however, was only 11%
Different sports recruit differently.
That's one reason why copying another athlete's recruiting strategy without understanding your sport can be dangerous.
The Multi-Channel Approach Works Best
One of the clearest trends we found was that athletes using multiple recruiting channels performed significantly better.
Families who combined:
Email
Social media
DMs
Camps/showcases
Multiple forms of exposure
Saw an average 59% increase in recruiting interest.
This makes sense.
Every additional channel creates another opportunity for coaches to discover and evaluate the athlete.
The athletes generating the most interest usually are not relying on just one recruiting method.
They're creating visibility everywhere.
Want help building a complete recruiting strategy? Inside Scholarship University, families get access to coach outreach scripts, school research tools, AI recruiting tools, and systems designed to help athletes maximize exposure.
Most Families Are Not Creating Enough Video
We also analyzed recruiting video volume.
The average family created 27.7 recruiting videos.
That could include:
Short clips
Individual highlights
Full game film
Highlight reels
But here's what's interesting:
The median was only 10 videos.
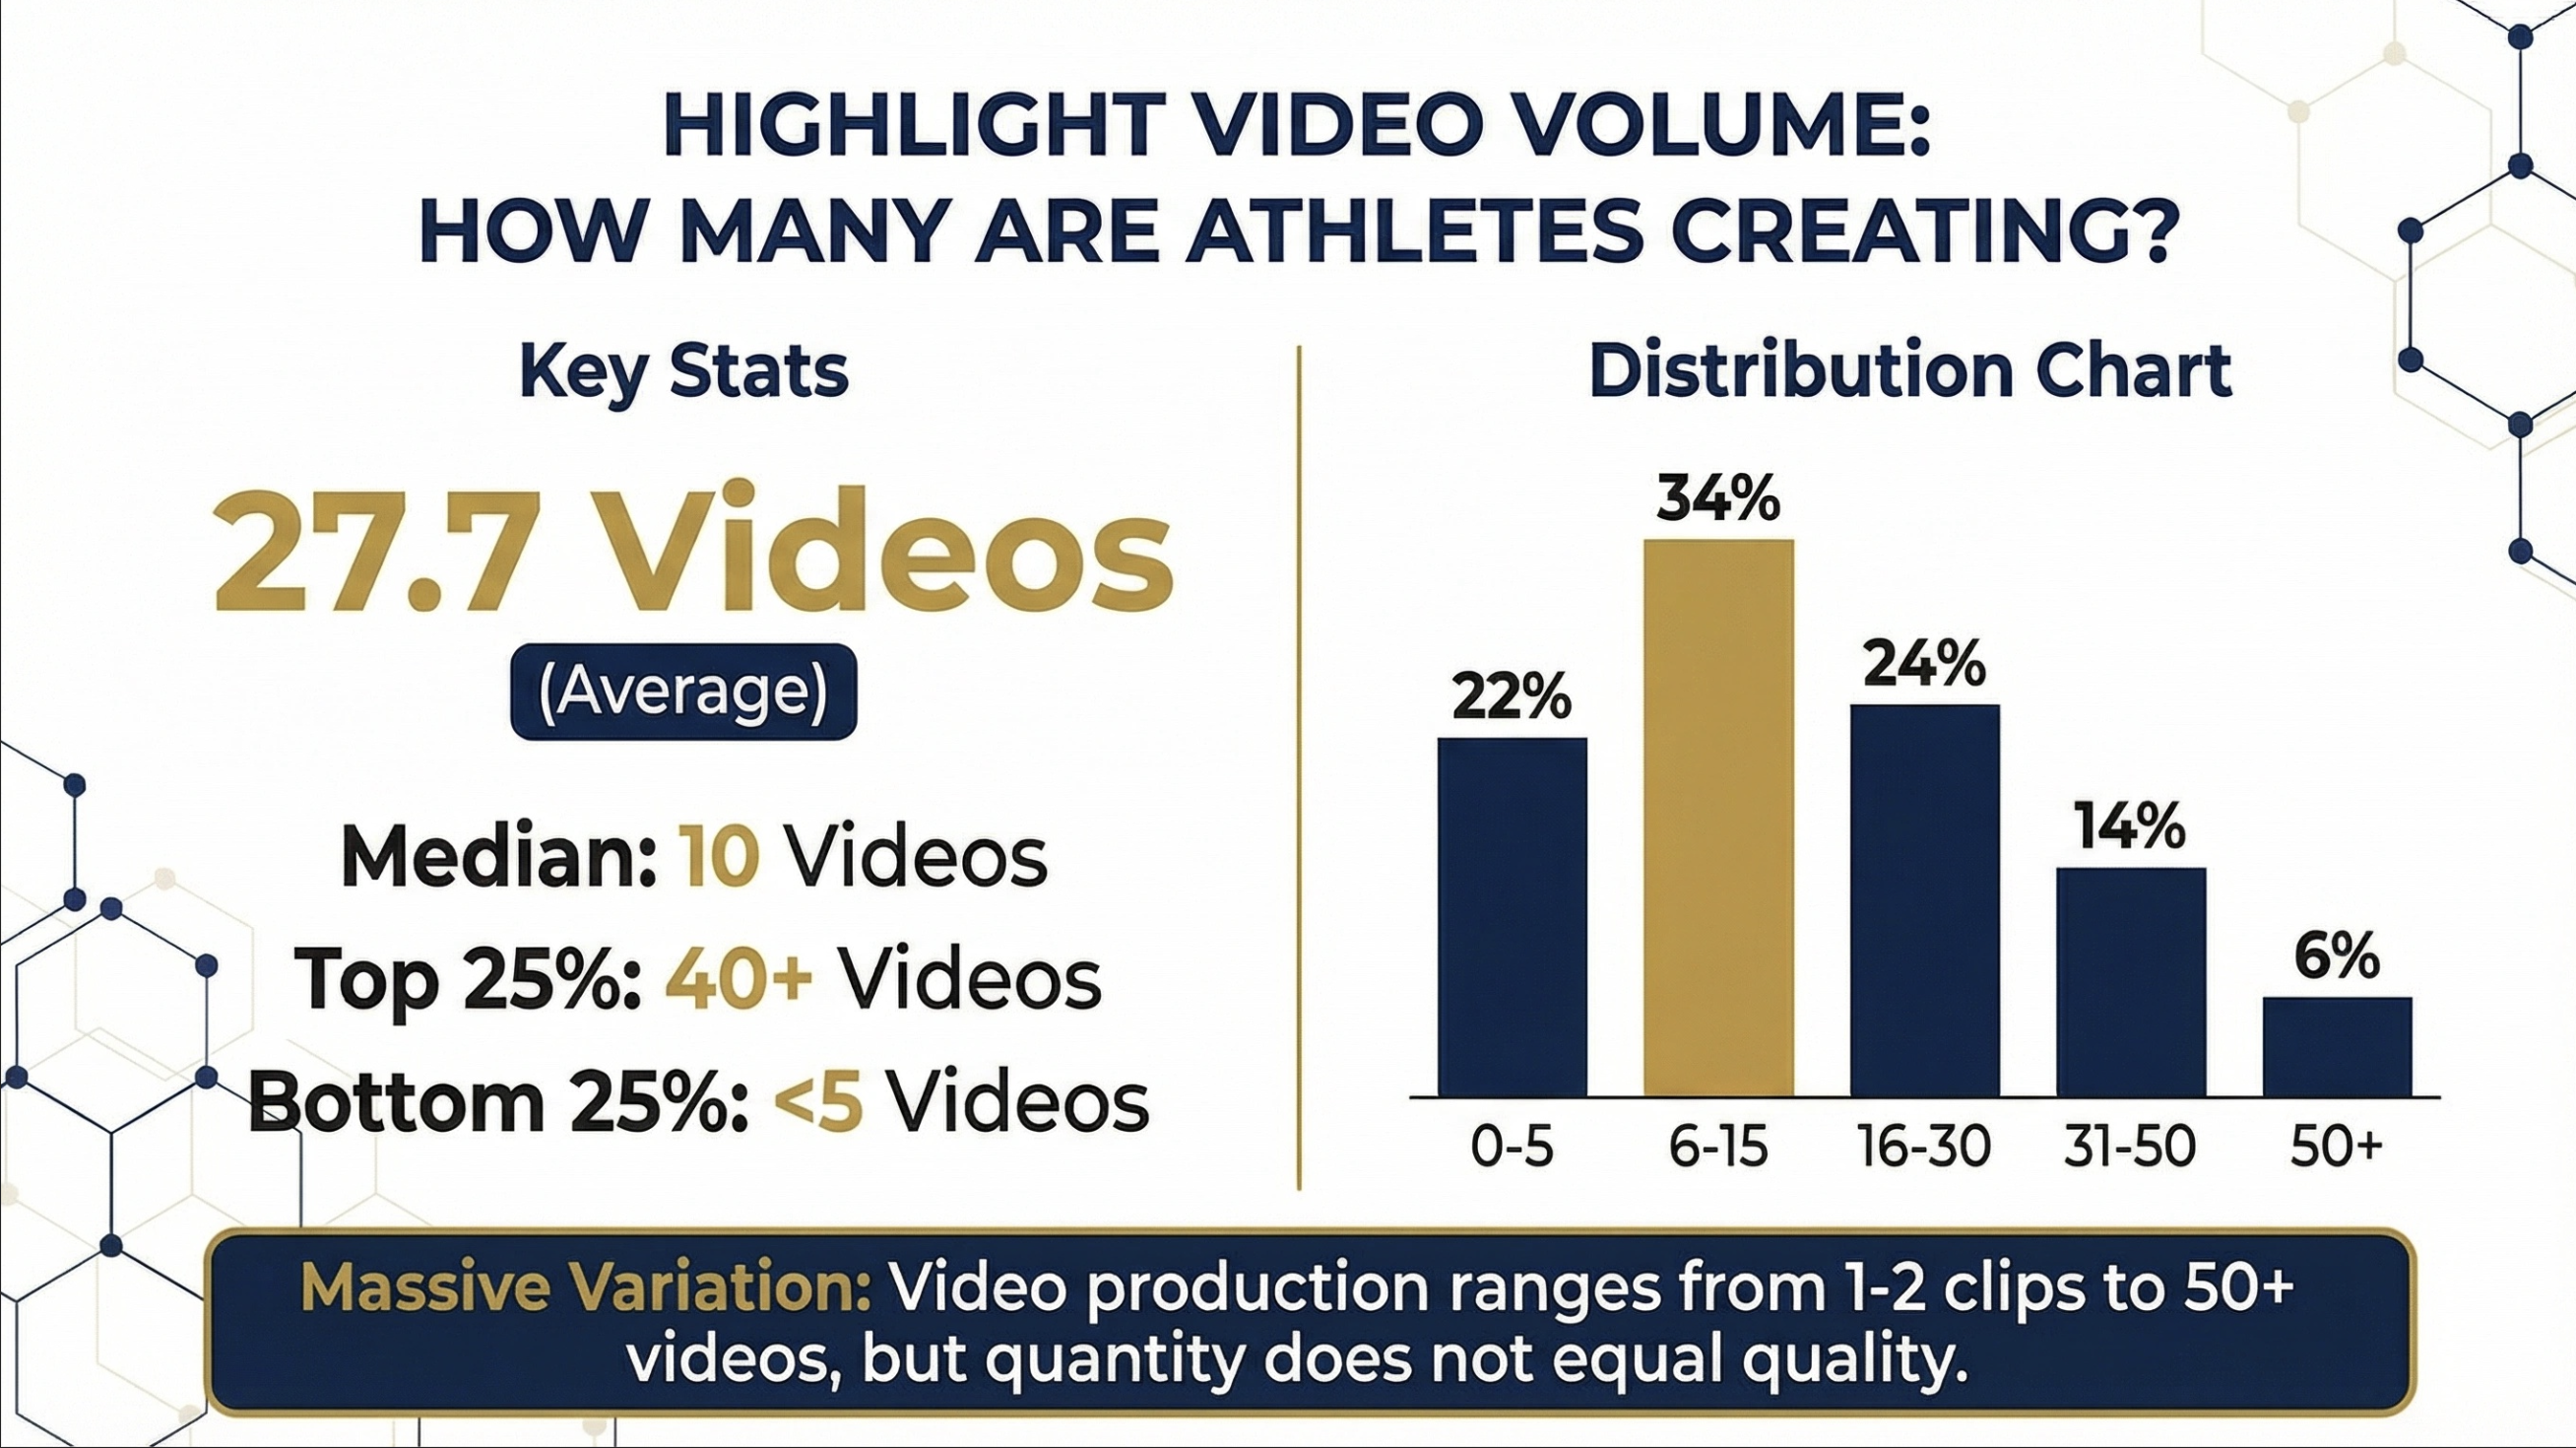
That means a relatively small percentage of families are producing a massive amount of content and pulling the average upward.
We also found:
Top 25% of families created 40+ videos
Bottom 25% created fewer than 5
This matters because video is one of the primary ways coaches evaluate athletes.
Families creating more video simply create more opportunities to be seen.
Most Families Spend Surprisingly Little Time on Recruiting
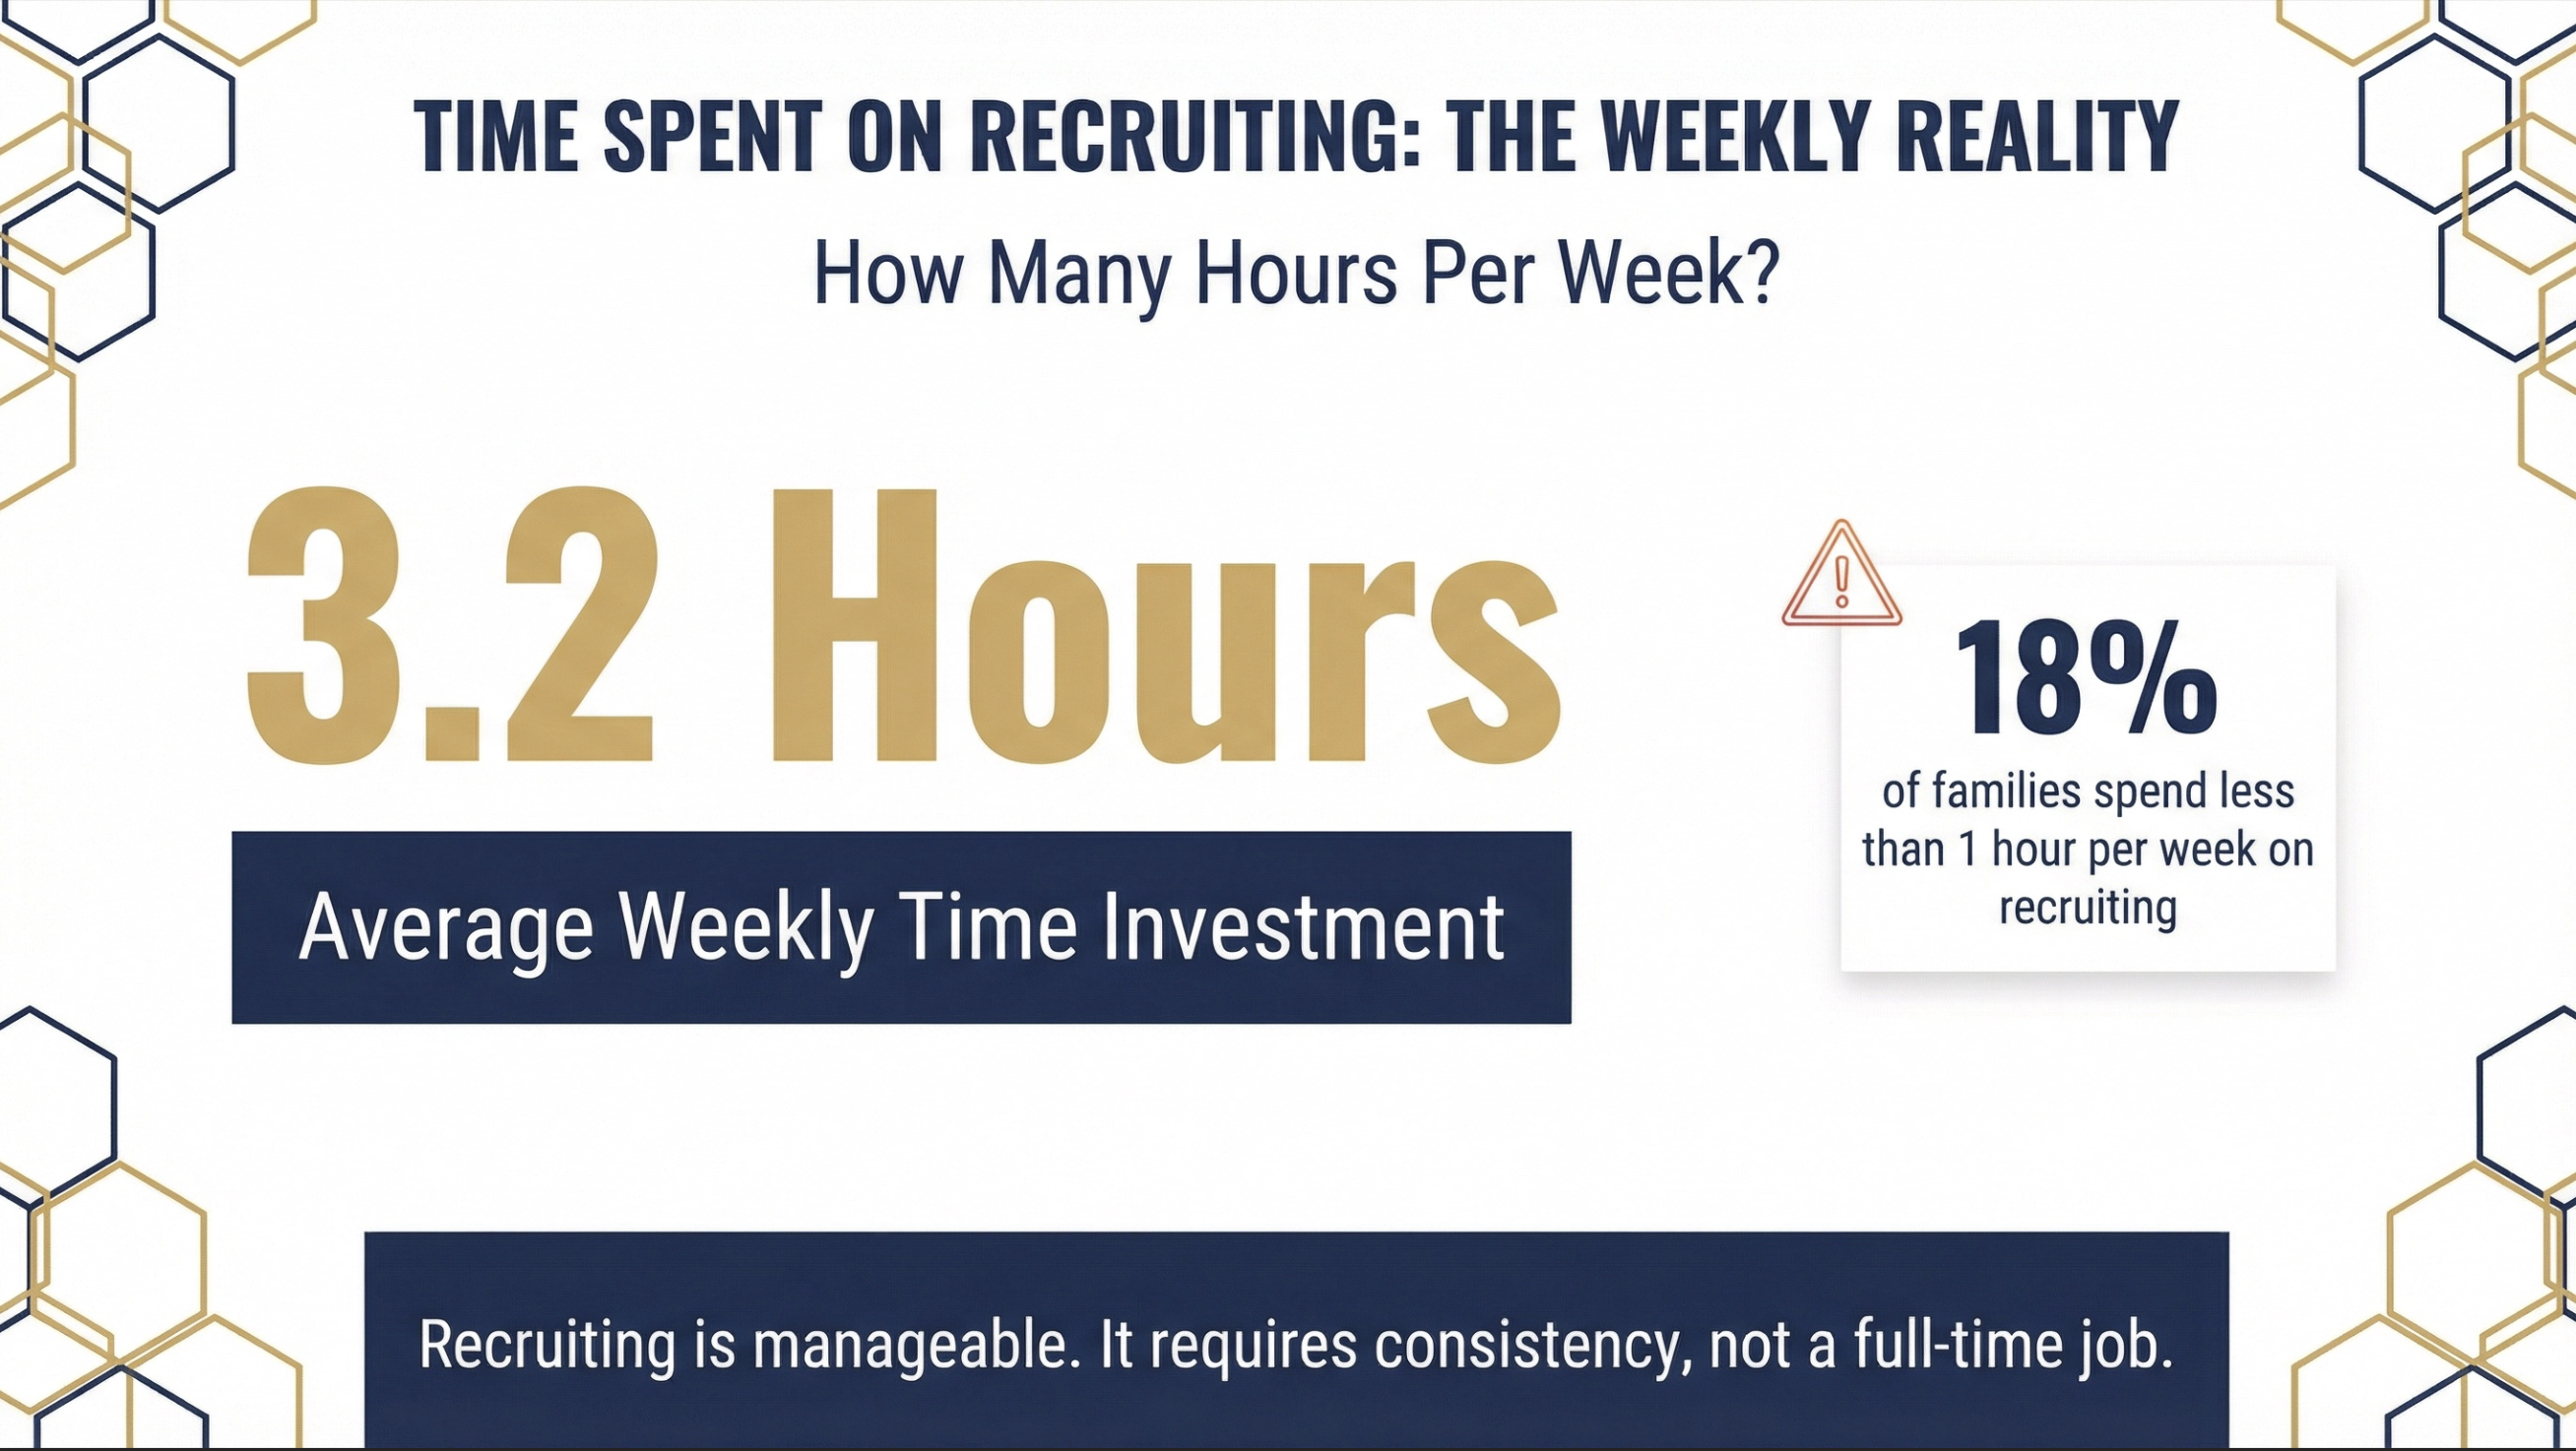
The average family spent about 3.2 hours per week on recruiting.
Even more surprising:
18% of families spent less than one hour per week on the recruiting process.
That's important because recruiting is competitive.
Families are competing for limited roster spots and scholarship opportunities.
And many athletes are trying to achieve those outcomes while investing very little time into the process.
Most Families Lack Confidence in Their Recruiting Plan
We also measured confidence levels on a scale of 1–5.
1 = not confident at all
5 = extremely confident
The average confidence score was just 2.9 out of 5.
Here's the breakdown:
30% had low confidence (1–2)
42% were neutral (3)
28% had high confidence (4–5)
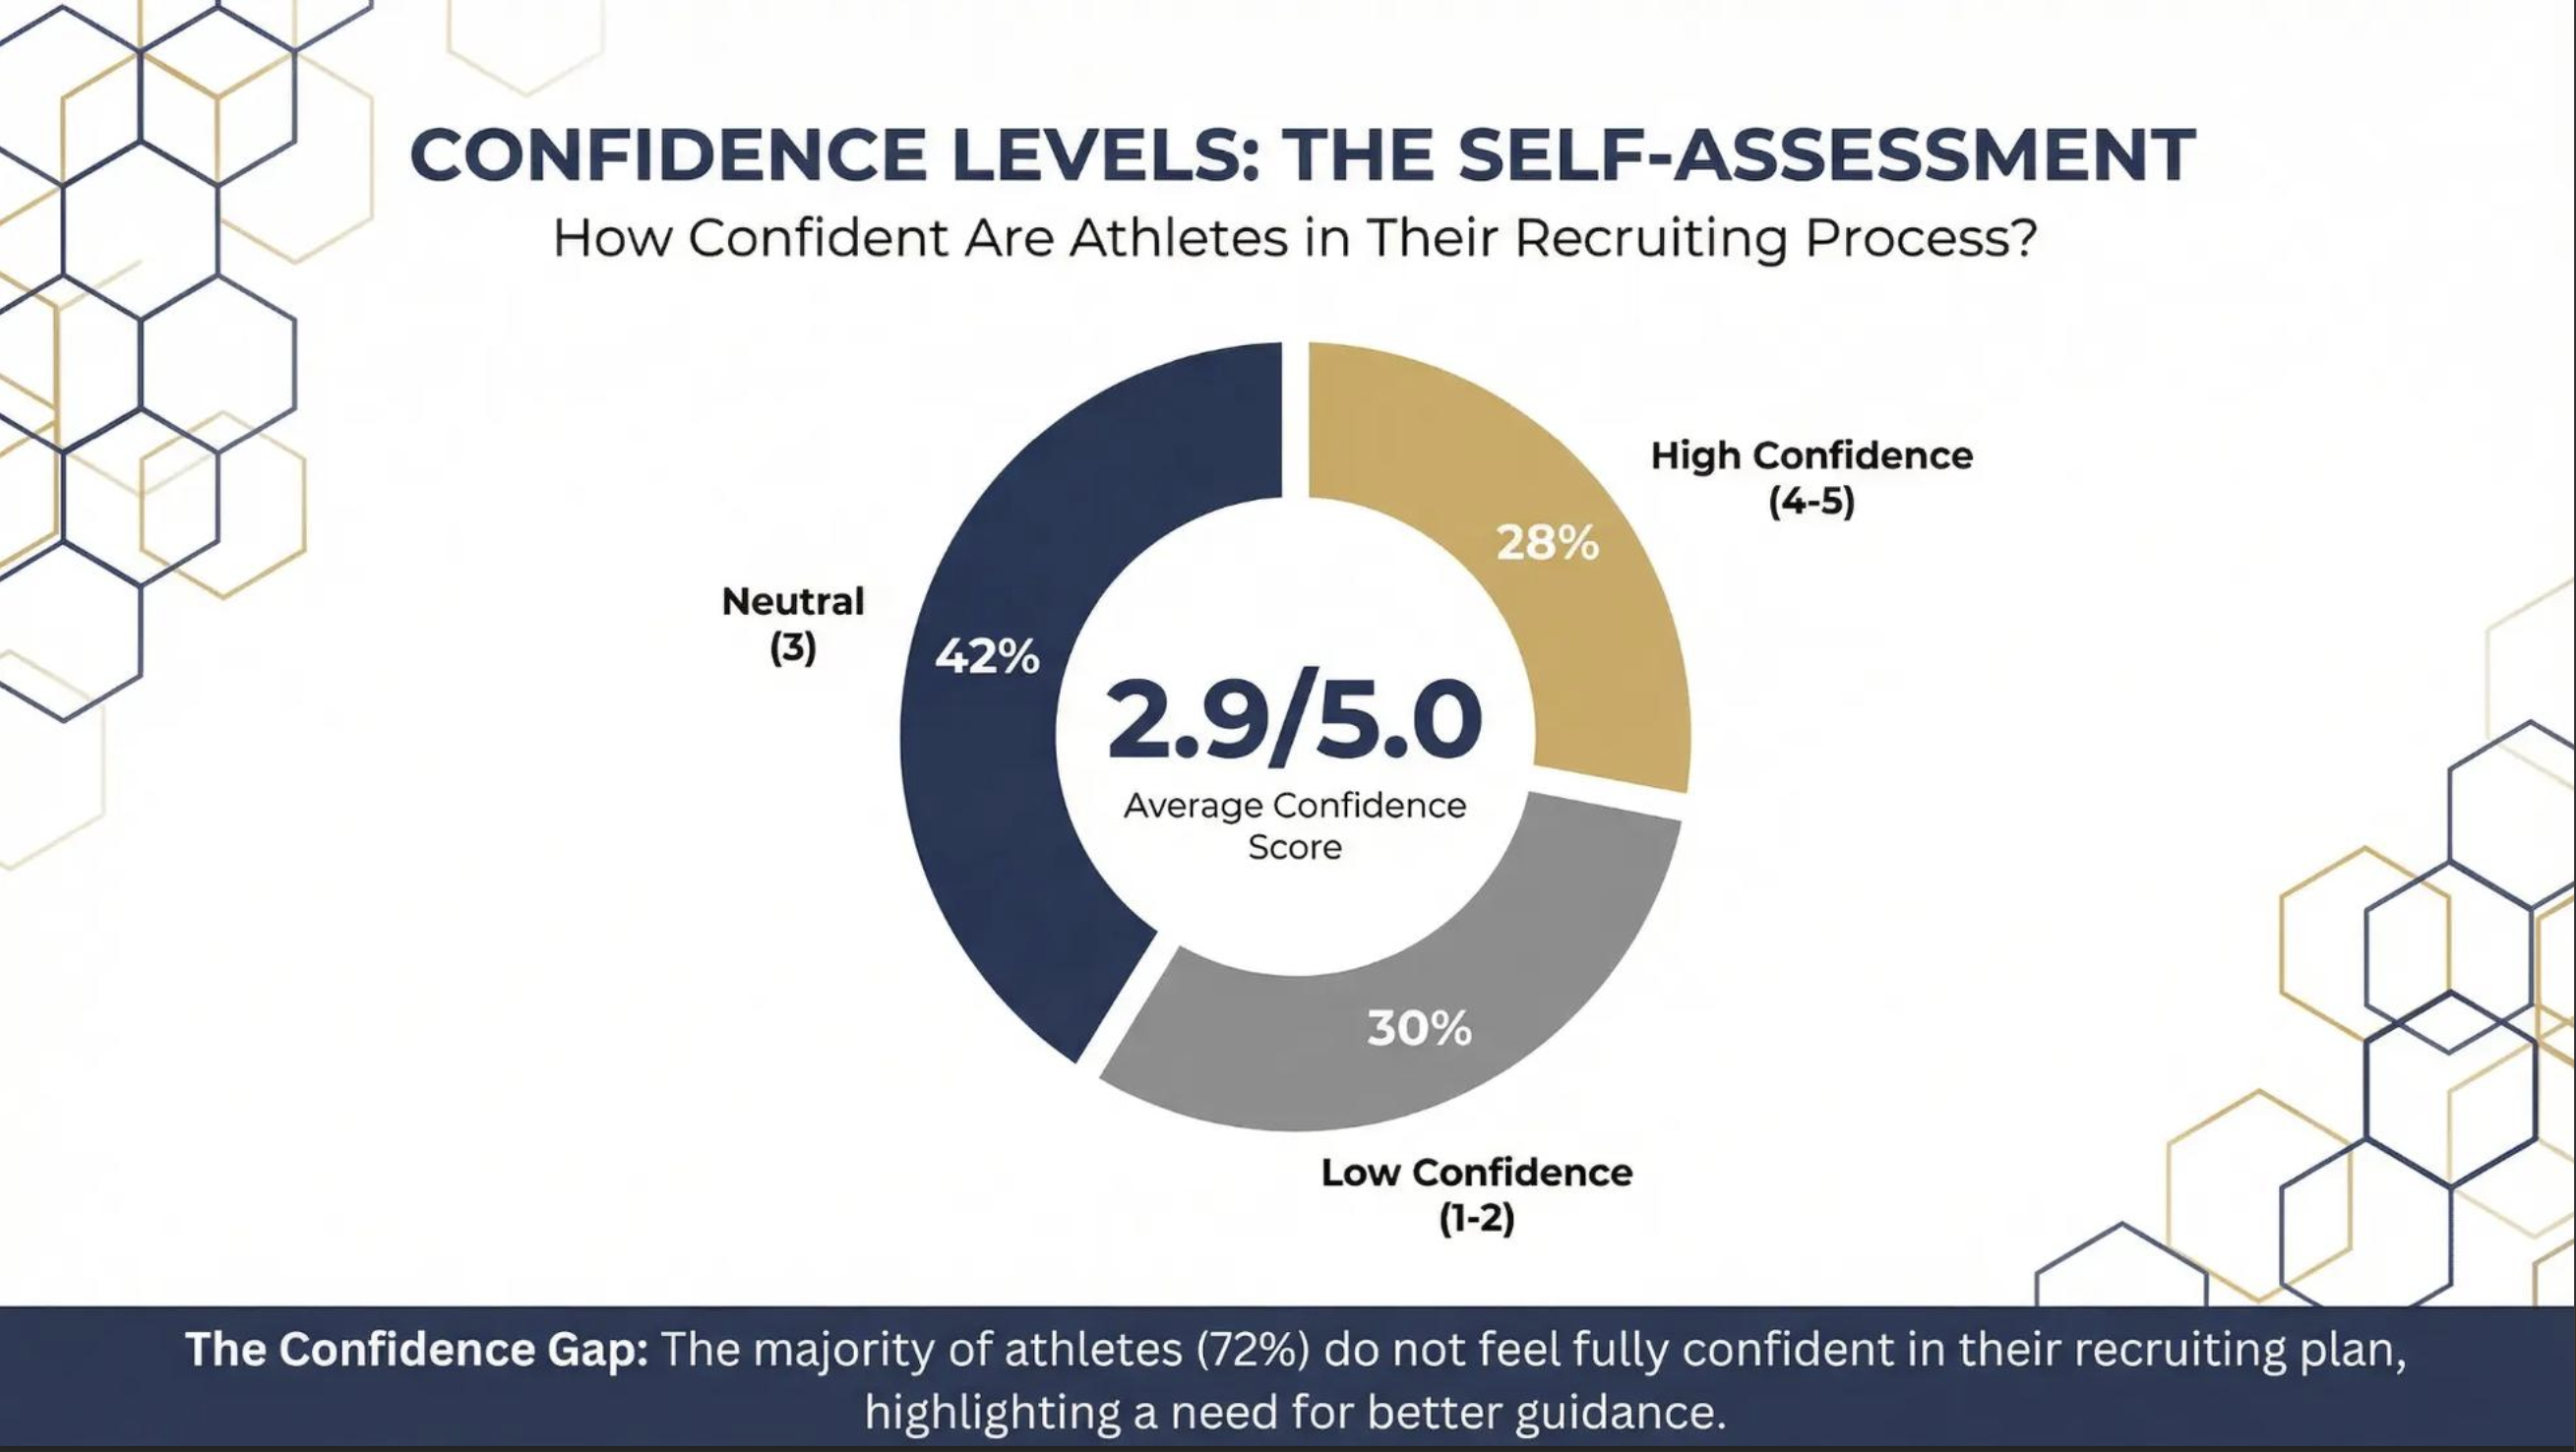
That means 72% of families do not feel fully confident in their recruiting plan.
That's a huge number.
And honestly, it makes sense.
Recruiting is confusing.
The rules change constantly.
Different sports recruit differently.
Most families have never gone through the process before.
GPA Matters More Than Many Families Realize
We also looked at academic performance.
The average GPA was 3.56.
The median GPA was 3.25.
Additionally:
11.3% of athletes were considered academically at risk (below 3.0 GPA)
12% were considered elite academically (4.0+ GPA)
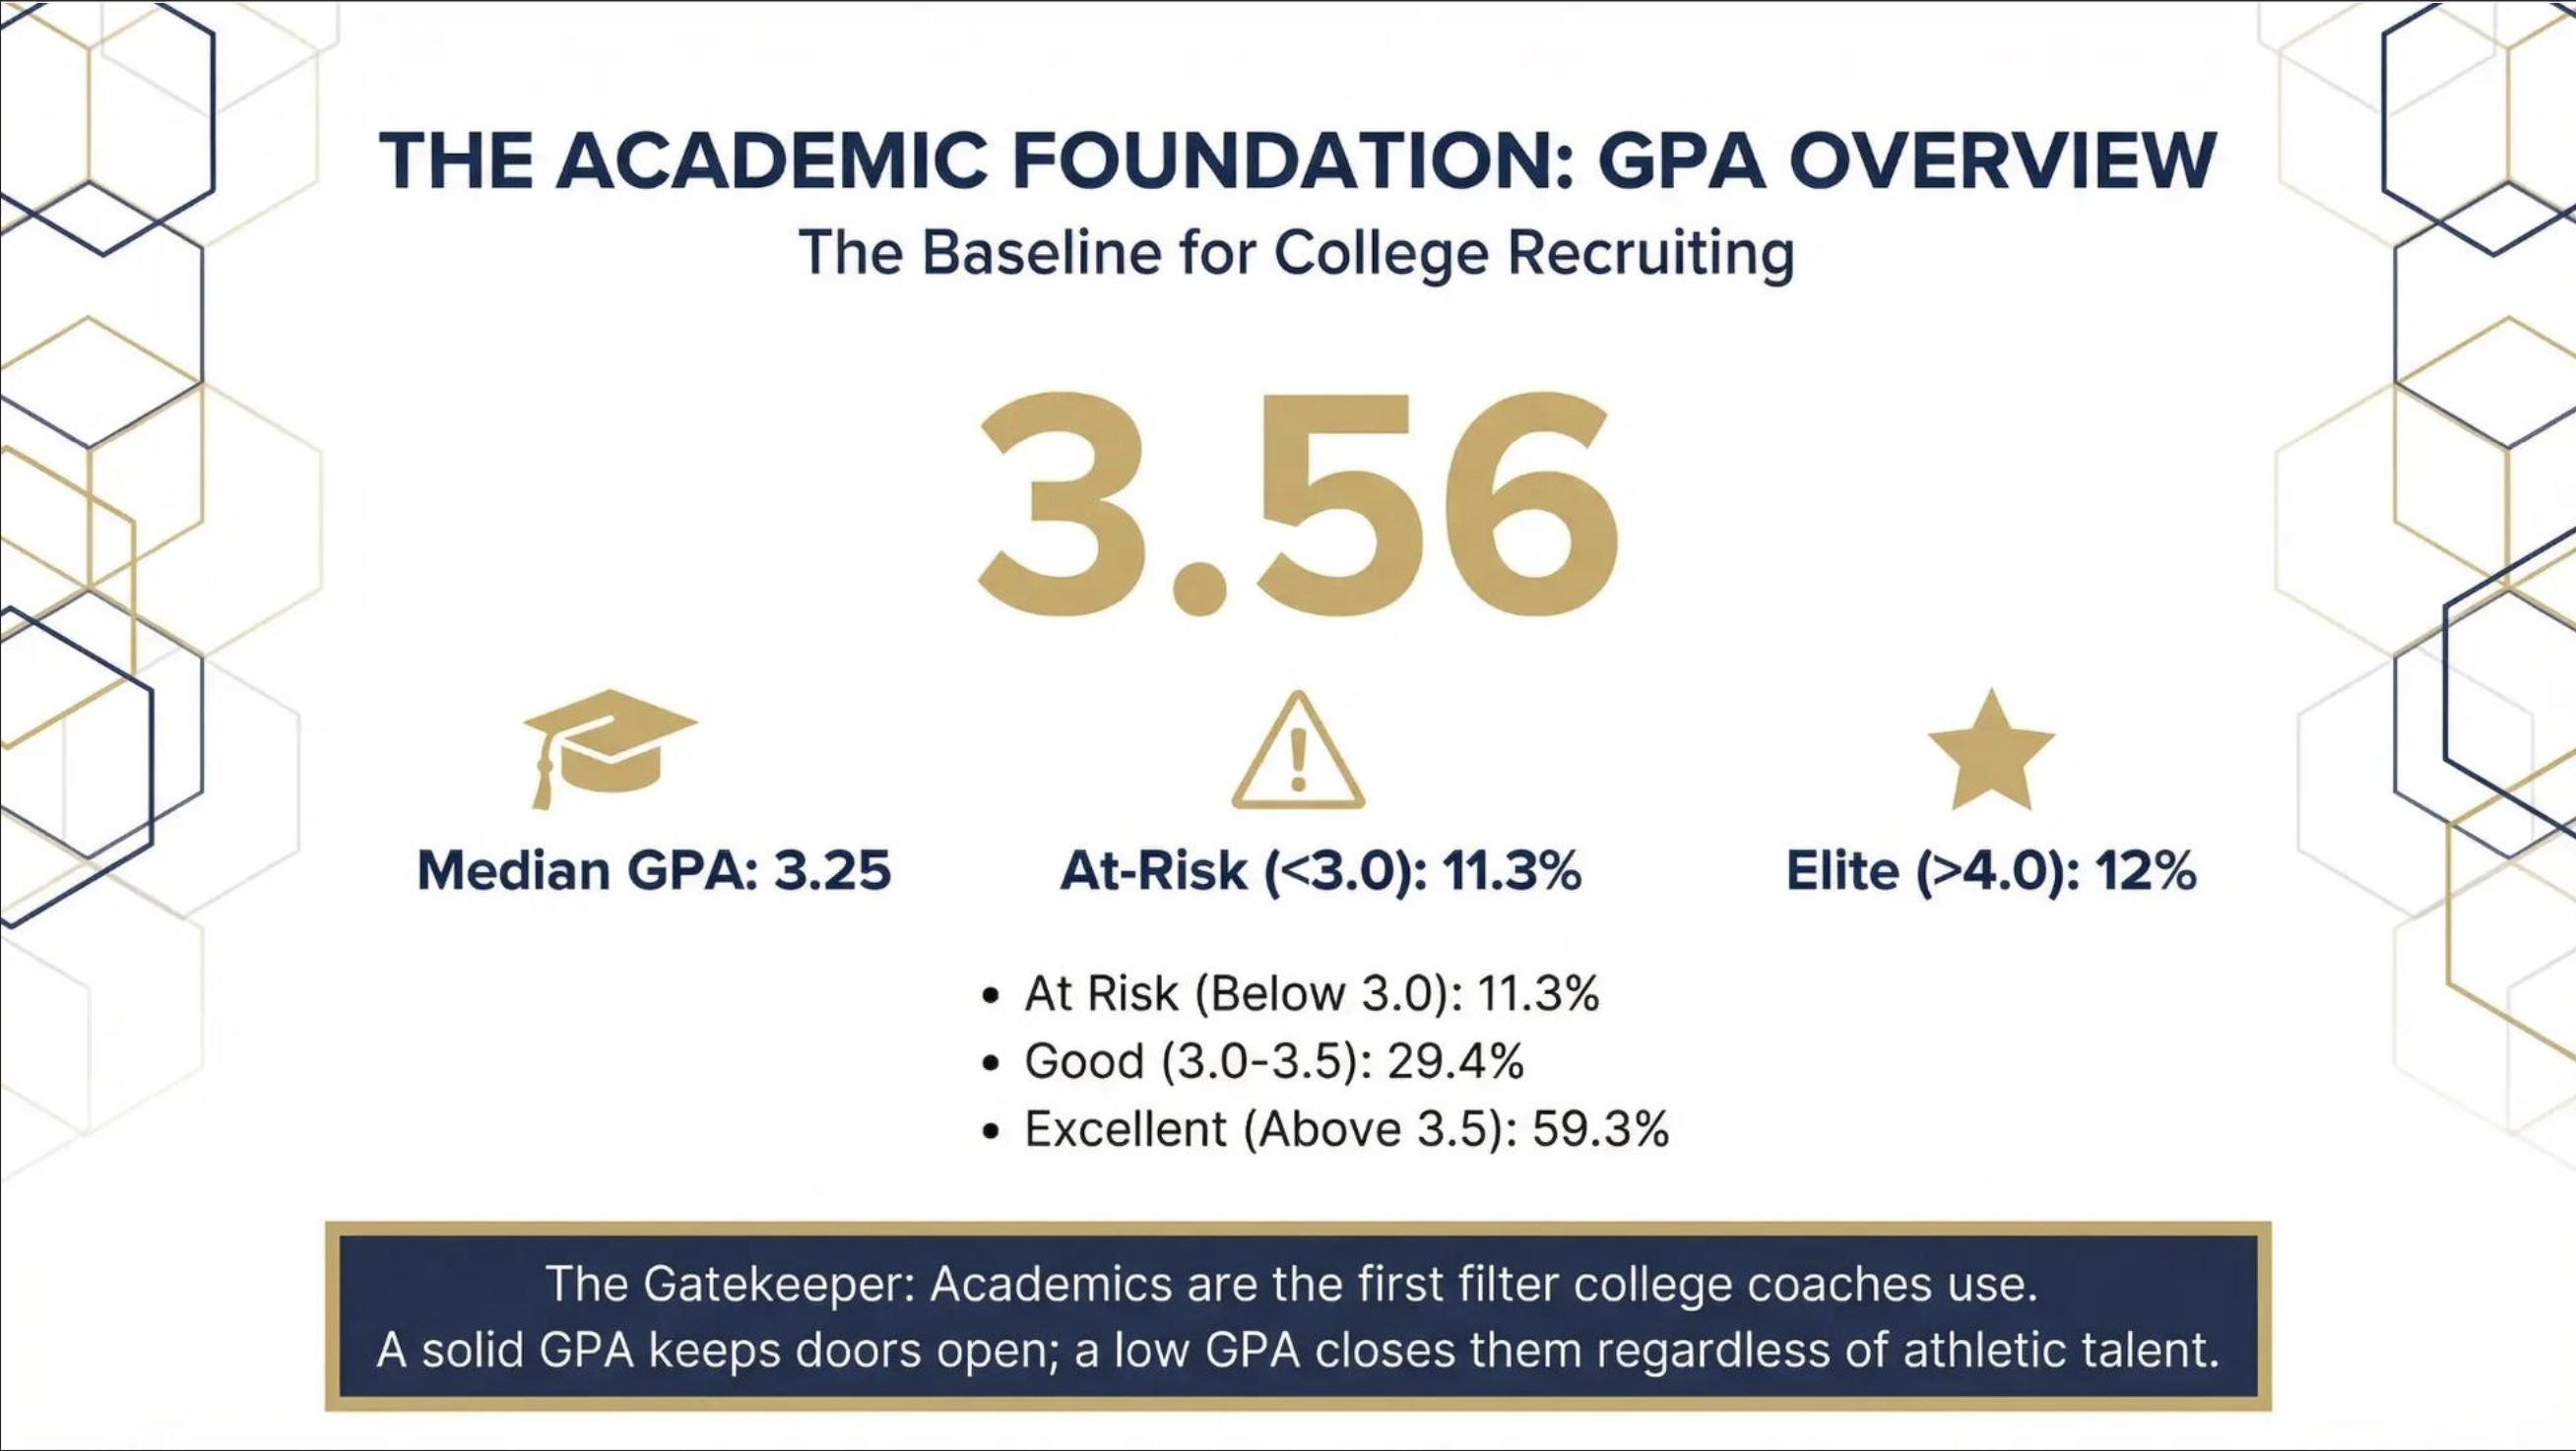
Academics matter because GPA impacts:
Admissions
Scholarship opportunities
Coach flexibility
Academic aid
Overall recruiting attractiveness
Strong academics create leverage.
The Differences Between the General Population and D1 Scholarship Clients Were Significant
Some of the most interesting findings came from comparing the general recruiting population to D1 Scholarship clients.
Average Scholarship Amount
General population: $39,088
D1 Scholarship clients: $82,938
Athletes Receiving $100K+ in Scholarships
General population: 7%
D1 Scholarship clients: 25%
Median Schools Contacted
General population: 40
D1 Scholarship clients: 150
Median Interested Schools
General population: 8
D1 Scholarship clients: 15
Median Recruiting Videos Created
General population: 10
D1 Scholarship clients: 62
One of the most interesting findings?
Time Investment Was Almost Identical
Both groups spent roughly 3 hours per week on recruiting.
That means D1 Scholarship families were generating:
More outreach
More exposure
More recruiting interest
More scholarship opportunities
Without spending significantly more time.
In other words:
The difference wasn't necessarily effort.
It was efficiency and strategy.
Quick resource: Download our free 2026 Recruiting Trends Report to see the biggest recruiting trends affecting athletes and families right now.
What Does All of This Mean?
After analyzing thousands of families, several patterns became very clear.
Most athletes are under-exposed.
They're not contacting enough schools.
Most athletes are under-leveraging video and content.
Families producing more video tend to generate more visibility.
Multi-channel recruiting works best.
Athletes relying on only one strategy tend to struggle.
Most families are uncertain.
The majority of families don't feel fully confident in their recruiting plan.
Strategy matters.
The families creating the best outcomes are not always spending more time.
They're usually operating with better systems, better positioning, and better exposure strategies.
Want Expert Help Navigating the Recruiting Process?
If you'd like personalized guidance and a complete recruiting strategy for your family, apply to work with our team.
We'll help your athlete create exposure, communicate with coaches, build targeted school lists, and maximize recruiting opportunities.